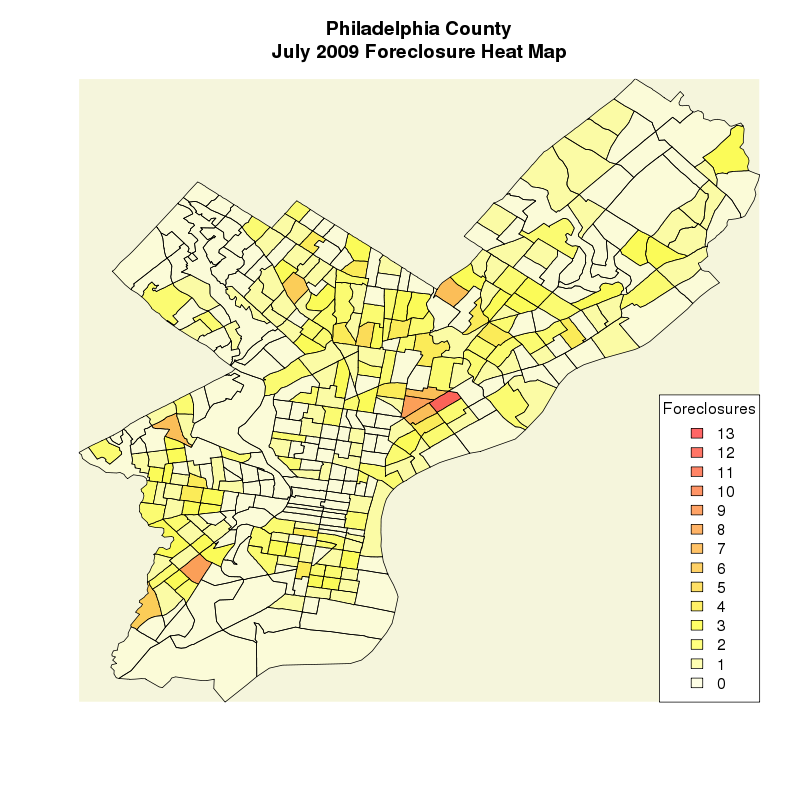
O’Reilly has published Data Mashups in R as a $4.99 PDF download1 in their Short Cut series. In 27 pages it takes you through an example of how to combine foreclosure information with maps and geographical information to produce plots like the one below. This is all done with the R statistical computing and analysis platform.
They show how to:
Use regular expressions to parse HTML files
Use the XML package to parse XML data from a web service (Yahoo! Geocode - no longer available?)
Find ERSI shape files for your maps
Use PBSmapping to process and display geographical data (GIS)
Importing and using US Census data with your maps
Footnotes
In 2023 no longer available as a single purchase.↩︎