We revisited the 3/2 rule of employee productivity using a larger data set and considering each sector independently.
For this second analysis we took the 4,595 constituents of the Standard & Poor’s Total Market Index (TMI) which offers broad market exposure to large-, mid-, small-, and micro-cap companies. After excluding companies where we could not get the data (and also companies with negative profits which are hard to show on the log-log plot), we were left with a broad selection of 4,099 listed US companies in nine sectors.
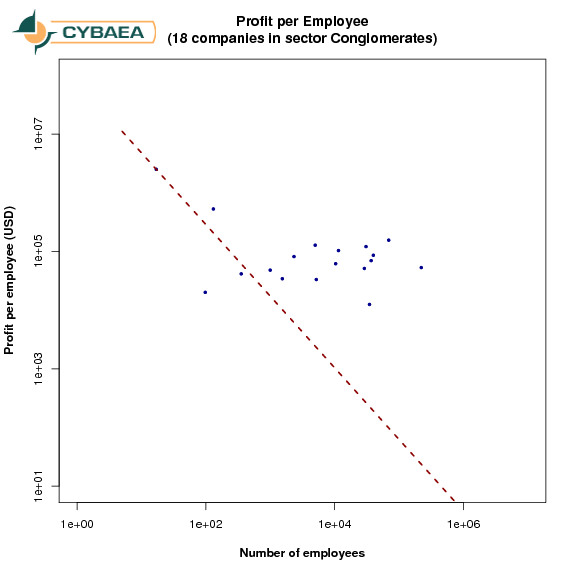
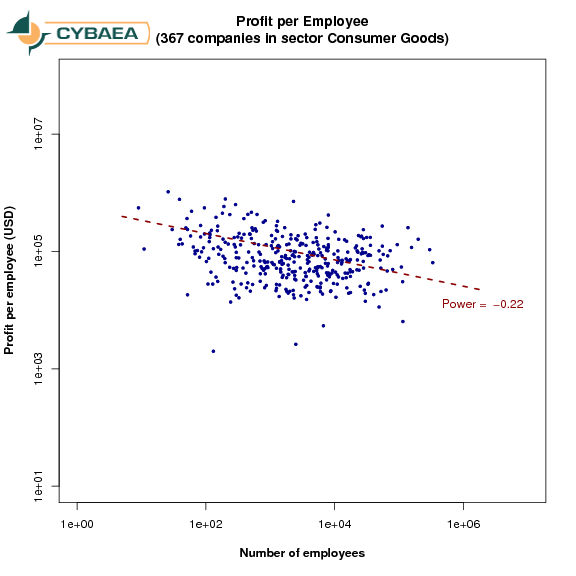
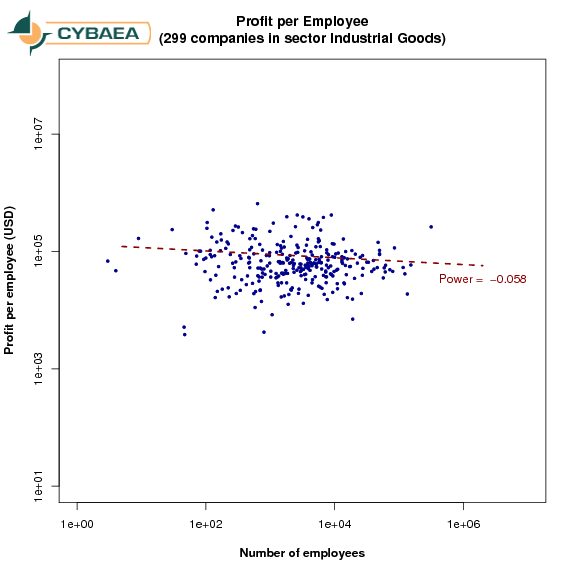
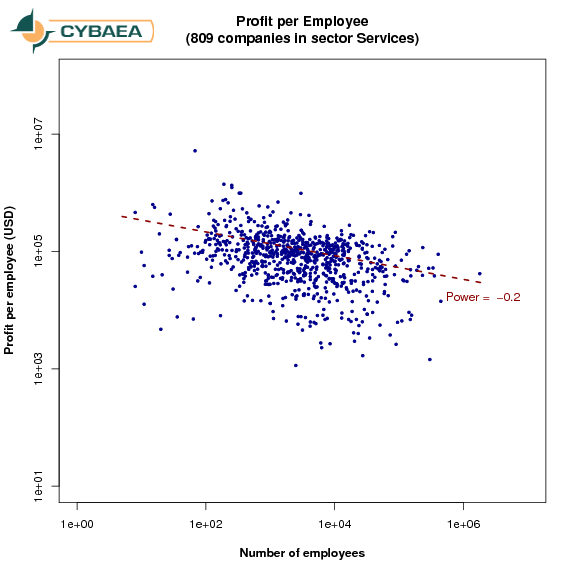
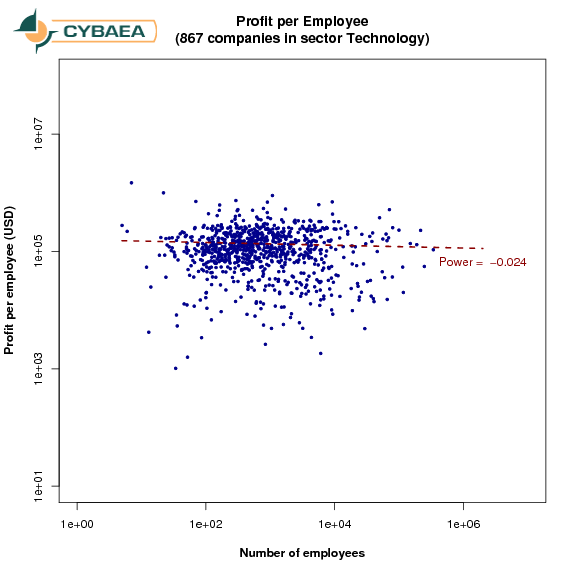
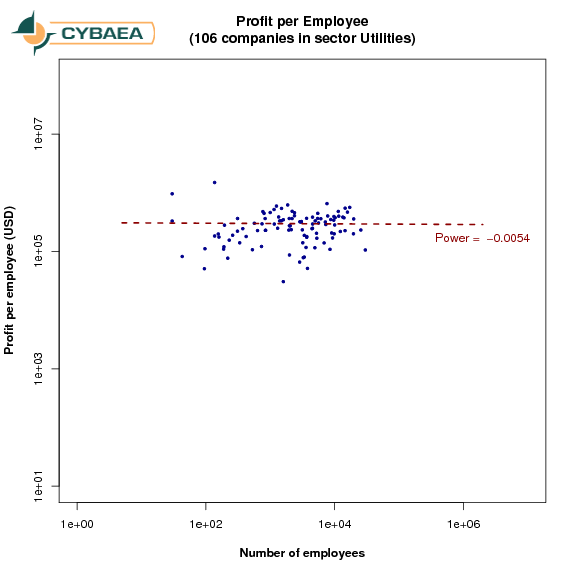
As before, we chose profits per employee as our metric for employee productivity and show it against the number of employees.
The resulting per-sector graphs are shown below (click through for a larger version). Broadly, all graphs are flat, i.e. there is little change in profits/employee with company size.
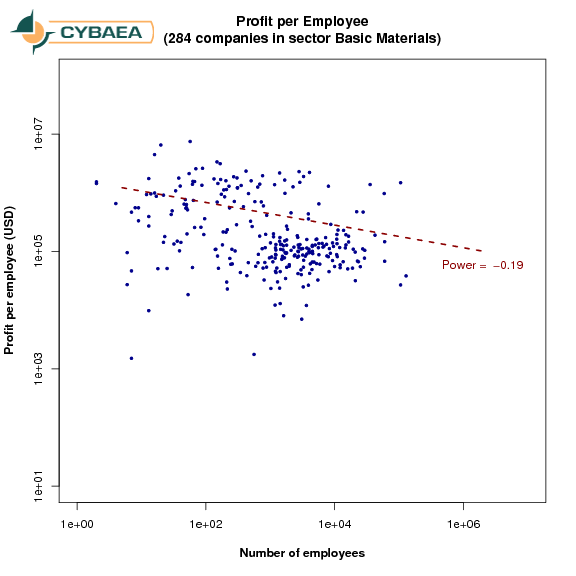
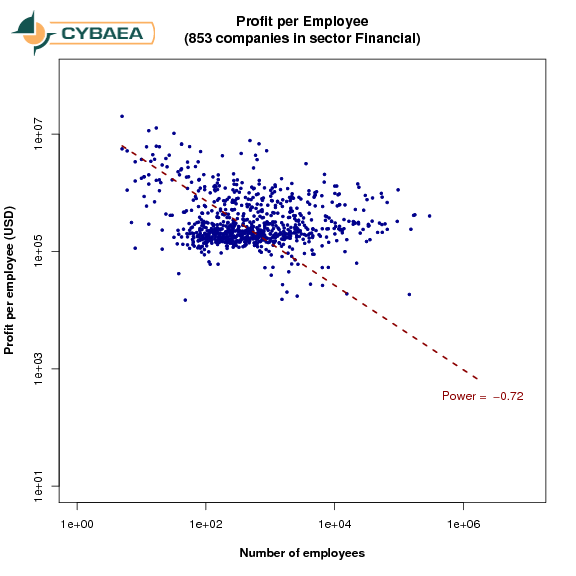
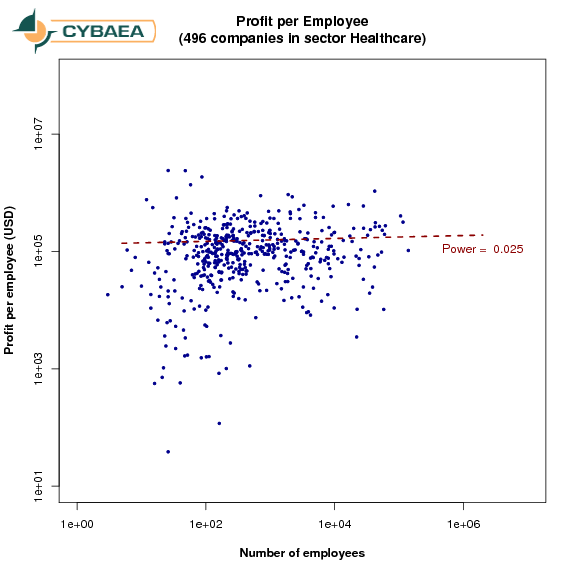
A couple of things are perhaps worth pointing out. The Healthcare sector has a large group of quoted companies that are clearly in the bottom left of the graph compared to the bulk of the distribution. I assume that many of these are R&D companies which are still in the process of trialling their new medicine. The Financial sector is large and has the opposite behaviour: a number of small but very profitable companies, which are usually companies managing large funds.
In total, there is probably a downward trend with size but with a slope of perhaps -0.1 or thereabouts. That still means that when you add 10% employees you lose 1% productivity per employee, which is clearly problematic. It is a much smaller number than the one we found before, primarily because the previous data set (the S&P 500) is biased against small companies with low revenues per employee. In the current data set we still have a bias in that they are all quoted companies which implies a certain size or at least cash position, but much less biased than before.
These numbers are very useful for benchmarking, and they certainly debunk any myths that large companies are more efficient, an oft-quoted statement in merger situations. In HR there are no efficiencies of scale. If there are efficiencies of scale in the other areas combined, then HR must scale negatively with size to give the flat result.
Citation
@online{2006,
  author = {},
  title = {The 3/2 Rule Revisited},
  date = {2006-10-19},
  url = {https://www.cybaea.net/Journal/2006/10/19/The-3-2-rule-revisited.html},
  langid = {en-GB-oxendict}
}